
HMI Examples |
Overview | ||
Below are some code snippets to help you get started designing HMI screens. Source code that contains SmartPage or SmartForm tags will need to be changed to meet your application's specifications. Also, as mentioned on the SmartForm page, you can have only one value changed in the SoftPLC per submission. This means that each form block can have only one field with a name parameter. But you can easily get around this by having multiple forms, as shown in the examples. Some of the examples use a hyperlink in order to replace the submit buttons. For example, when there are multiple forms, they can be named f1 and f2. And then to submit the form with a hyperlink, use:
<a href="javascript:document.f1.submit();">Submit</a> for the f1 form, and
<a href="javascript:document.f2.submit();">Submit</a> for the form named f2.
Date/Time | ||
Below is an example of how to display a date/time combination using DecimalFmt.
<!-- This would show the month/day/year. -->
<a href="@DecimalFmt(S19,#0)">0</a>/<a href="@DecimalFmt(S20,#0)">0</a>/<a href="@DecimalFmt(S18,#0)">0</a>
<!-- This would show the hour:minute:second. -->
<a href="@DecimalFmt(S21,#00)">00</a>:<a href="@DecimalFmt(S22,#00)">00</a>:<a href="@DecimalFmt(S23,#00)">00</a>
The displayed result would look something like what is shown below. (S19 is the month, S20 is the day, S18 is the year and S21 is the hour, S22 is the current minute, and S23 is the current second.)
11/30/2005 08:55:23
Basic Formatting | ||
This example simply shows how through the use of HTML tables and our sample images, even HMI screens can be created. Of course, for static graphics, you can always create your own, or find them in graphic libraries.
<table border="0" cellspacing="0" cellpadding="0">
  <tr>
    <td><img src="pipe_vert.png" width="32" height="32"></td>
    <td> </td>
    <td><img src="pipe_vert.png" width="32" height="32"></td>
    <td> </td>
    <td> </td>
  </tr>
  <tr>
    <td><img src="pipe_valve_open.png" width="32" height="32"></td>
    <td> </td>
    <td><img src="pipe_valve_closed.png" width="32" height="32"></td>
    <td> </td>
    <td> </td>
  </tr>
  <tr>
    <td><img src="pipe_2.png" width="32" height="32"></td>
    <td><img src="pipe_horiz.png" width="80" height="32"></td>
    <td><img src="pipe_c_2.png" width="32" height="32"></td>
    <td><img src="pipe_horiz.png" width="40" height="32"></td>
    <td><img src="pipe_4.png" width="32" height="32"></td>
  </tr>
  <tr>
    <td> </td>
    <td> </td>
    <td> </td>
    <td> </td>
    <td><img src="pipe_vert.png" width="32" height="42"></td>
  </tr>
</table>
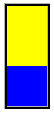
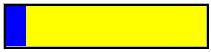
Status Bars | ||
Due to the power of HTML and JavaScript, you can easily develop bar graphs or other complex controls. In the examples below, N7:1 is a number between 0 and 100. The bar sizes will be based on the value of N7:1. (In the horizontal status bar example, the values are multiplied by 2 to make it look longer).
<table cellpadding=0 cellspacing=0 border=1 style="border: 3px ridge">
<tr><td><script language="JavaScript">
   // This line is the SmartPage macro. N7:1 is the value that is being returned
   var h1 = <a href="@DecimalFmt(N7:1,#0)">0</a>;
   var h2 = 100 - h1;
   document.write('<img src="bar_yellow.png" width=40 height=' + h2 + '>');
   document.write('<br>');
   document.write('<img src="bar_blue.png" width=40 height=' + h1 + '>');
</script></td></tr>
</table>
<table cellpadding=0 cellspacing=0 border=1 style="border: 3px ridge">
<tr><td><script language="JavaScript">
   // This line is the SmartPage macro. N7:1 is the value that is being returned
   var h1 = <a href="@DecimalFmt(N7:1,#0)">0</a> * 2;
   var h2 = 100*2 - h1;
   document.write('<img src="bar_yellow.png" width=' + h2 + ' height=40>');
   document.write('<br>');
   document.write('<img src="bar_blue.png" width=' + h1 + ' height=40>');
</script></td></tr>
</table>
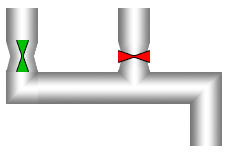
Tank and Valves | ||
This example shows usage of both ImageChoice and DecimalFormat tags to make a graphical display. (Again using only HTML tables and images).
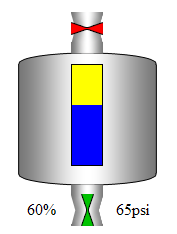
<table border="0" cellspacing="0" cellpadding="0">
  <tr>
    <td> </td>
    <!-- N7:3 is the word that will be examined -->
    <td><a href="@ImageChoice(N7:3,0x1,pipe_valve_closed.png,0x1,pipe_valve_open.png"> </a></td>
    <td> </td>
  </tr>
  <tr>
    <td><img src="tank_01.png" width="59" height="150"></td>
    <td valign="top" background="tank_02.png"> <br>
      <table width="30" height="100" border="0"
            cellpadding="0" cellspacing="0" style="border: 1px solid">
        <tr>
          <td><script language="JavaScript">
   // The value of N7:2 will be inserted below by the SmartPage servlet
   var h1 = <a href="@DecimalFmt(N7:2,#0)">0</a>;
   var h2 = 100 - h1;
   document.write('<img src="bar_yellow.png" width=30 height=' + h2 + '>');
   document.write('<br>');
   document.write('<img src="bar_blue.png" width=30 height=' + h1 + '>');
</script></td>
        </tr>
      </table>
    </td>
    <td><img src="tank_03.png" width="59" height="150"></td>
  </tr>
  <tr>
    <!-- This next macro will insert N7:2. In this example, it is the % full of
    the tank. -->
    <td align="center"><a href="@DecimalFmt(N7:2,#0)">0</a>%</td>
    <!-- N7:0 will be examined to determine if the valve is closed/open. -->
    <td><a href="@ImageChoice(N7:0,0x1,pipe_valve_closed.png,0x1,pipe_valve_open.png)"> </a></td>
    <!-- N7:1 is the value in the SoftPLC that represents the pressure of the tank -->
    <td align="center"><a href="@DecimalFmt(N7:1,#0)">0</a>psi</td>
  </tr>
</table>
Bit States | ||
This example uses ImageChoice and SmartForm to allow you to change and display the state of the valve.
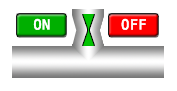
<table border="0" cellspacing="0" cellpadding="0">
<tr>
  <td><form ACTION="/servlet/SmartForm" NAME="f1" METHOD="GET" >
	<!-- These 2 lines will switch the N7:0/0 bit to ON -->
    <input type="hidden" name="N7:0/0,ON" value="N7:0/0,ON">
	<a href="javascript:document.f1.submit();"><img
            src="on.png" width="60" height="32" border="0"></a></form></td>
  <td valign="bottom" background="pipe_vert.png">
  <!-- Shows the status of N7:0 as an image -->
  <a href="@ImageChoice(N7:0,0x1,pipe_valve_closed.png,0x1,pipe_valve_open.png)">
    </a></td>
  <td><form ACTION="/servlet/SmartForm" NAME="f2" METHOD="GET" >
	<!-- These 2 lines will switch the N7:0/0 bit to OFF -->
    <input type="hidden" name="N7:0/0,OFF" value="N7:0/0,OFF">
	<a href="javascript:document.f2.submit();"><img
            src="off.png" width="60" height="32" border="0"></a></form></td>
</tr>
<tr>
  <td background="pipe_horiz.png"> </td>
  <td><img src="pipe_c_2.png" width="32" height="32"></td>
  <td background="pipe_horiz.png"> </td>
</tr>
</table>
Dial | ||
Here SmartPage is combined with SmartForm to make a dial.

<table cellpadding=0 cellspacing=0 border=1 style="border: 3px ridge">
<tr><td colspan=2 align="center"><a href="@DecimalFmt(N7:1,#0)">0</a></td></tr>
<tr><td><script language="JavaScript">
   // This will insert the value of N7:1 so that the JavaScript can create
   // values that will allow the dials to increase/decrease it
   var cur = <a href="@DecimalFmt(N7:1,#0)">0</a>;
   var up = cur+1;
   var down = cur-1;
   document.write('<form ACTION="/servlet/SmartForm" NAME="f1" METHOD="GET" >');
   // This is a little complicated, but it will have the current value of N7:1 + 1
   // and submitting the form will thus "increment" the N7:1 word
   document.write('<input TYPE="hidden" NAME="N7:1" VALUE="' + up + '">');
   document.write('<a href="javascript:document.f1.submit();">');
   document.write('<img src="up.png" border=0></a>');
   document.write('</form>');
   document.write('</td><td>');
   document.write('<form ACTION="/servlet/SmartForm" NAME="f2" METHOD="GET" >');
   // This is a little complicated, but it will have the current value of N7:1 - 1
   // and submitting the form will thus "decrease" the N7:1 word
   document.write('<input TYPE="hidden" NAME="N7:1" VALUE="' + down + '">');
   document.write('<a href="javascript:document.f2.submit();">');
   document.write('<img src="down.png" border=0></a>');
   document.write('</form>');
</script></td></tr>
</table>
Slider | ||
This example is a little more complex, but it allows you to have a slider component. First, the following needs to be within the HEAD tag of your HTML document. (These files can be downloaded here).
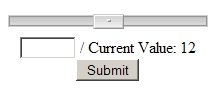
<link rel="stylesheet" type="text/css" href="slider.css">
<script type="text/javascript" src="addanevent.js"></script>
<script type="text/javascript" src="slider.js"></script>
<script type="text/javascript" src="slider-setup.js"></script>
As the DIV and INPUT tags can be added into the BODY section of the document, you can lay them out however you wish. Because these are standard HTML tags, you can lay them out as standard HTML components!
<form name="f1" method="GET" action="/servlet/SmartForm">
<div class="slider" id="slider01">
	<div class="left"></div>
	<div class="right"></div>
	<img src="knob.png" width="31" height="15" >
</div>
<input id="output1" name="N7:3" size="5">
   / Current Value: <a href="@DecimalFmt(N7:3,#0)">0</a>
<br><a href="javascript:document.f1.submit();">Submit</a>
</form>
If you want additional sliders per page, then you simply copy the above source onto the page, but use a different id for both the DIV and INPUT (for example: id="slider02" and id="output2"). Additionally, you would need to change the FORM's NAME parameter and the submission link to match it (ie: from name="f1" to name="f2" and from document.f1.submit() to document.f2.submit()). Afterwards, you would need to open the slider-setup.js file and add additional lines to match the configuration of slider[1]. You would be adding another stanza to the file for slider[2]. For instance:
slider[2]=new Object();
slider[2].min=-100;
slider[2].max=100;
slider[2].val=100/3;
slider[2].onchange=setBoxValue;
And one final possible configuration is to change the width of the sliders. Open slider.css and change line 4 to patch your desired dimension.
And of course, all of the images, CSS and JavaScript files must be in the same directory.
PID Faceplate | ||
Below is another complex example, a PID faceplate. It combines the use of status bars and the dial.
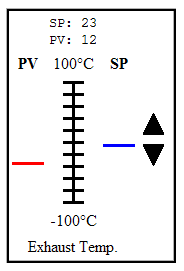
<table border="0" cellspacing="0" cellpadding="3" style="border: 3px ridge">
<tr align="center">
  <td colspan="3"><tt>
    <!-- These next 2 lines will show the values of the
    SP/PV values -->
    SP: <a href="@DecimalFmt(PD13:5.1,#0)">0</a><br>
    PV: <a href="@DecimalFmt(PD13:5.2,#0)">0</a>
    </tt></td>
  <td></td>
</tr>
<tr align="center">
  <th>SP</th>
  <td>100°C</td>
  <th>PV</th>
</tr>
<tr>
  <td align="right" valign="top"><script language="JavaScript">
       // The PV value
       var h1 = 100 - <a href="@DecimalFmt(PD13:5.2,#0)">0</a>;
       document.write('<img src="blank.png" width=32 height=' + h1 + '>');
    </script><br>
    <img src="bar_red.png" width="32" height="3"> </td>
  <td align="center" valign="top"><img src="ticks.png" width="27" height="125"></td>
  <td align="left" valign="top"><script language="JavaScript">
       // The SP value
       var h1 = 100 - <a href="@DecimalFmt(PD13:5.1,#0)">0</a>;
       document.write('<img src="blank.png" width=32 height=' + h1 + '>');
    </script><br>
    <img src="bar_blue.png" width="32" height="3"> </td>
  <td><form ACTION="/servlet/SmartForm" METHOD="GET" name="f1">
        <script language="JavaScript">
      // The SP value, again
      var cur = <a href="@DecimalFmt(PD13:5.1,#0)">0</a>;
      var up = cur+1;
      var down = cur-1;
      document.write('<input TYPE="hidden" NAME="PD13:5.1" VALUE="' + up +'">');</script>
      <a href="document.f1.submit();"><img src="up.png" border="0"></a>
    </form>
    <form ACTION="/servlet/SmartForm" METHOD="GET" name="f2">
    <script language="JavaScript">
      // The SP value, again!
      var cur = <a href="@DecimalFmt(PD13:5.1,#0)">0</a>;
      var up = cur+1;
      var down = cur-1;
      document.write('<input TYPE="hidden" NAME="PD13:5.1" VALUE="' + down +'">');</script>
      <a href="document.f2.submit();"><img src="down.png" border="0"></a>
    </form></td>
</tr>
<tr>
  <td valign="top"> </td>
  <td valign="top">-100°C</td>
  <td valign="top"> </td>
  <td> </td>
</tr>
<tr>
  <td colspan="3" align="center">Exhaust Temp.</td>
  <td> </td>
</tr>
</table>
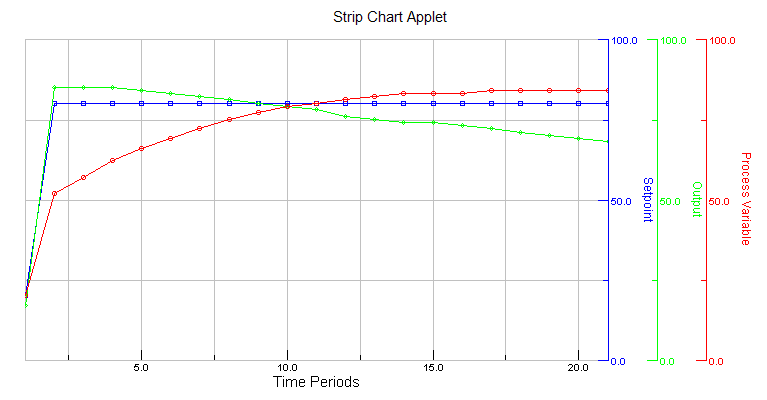
Trend Graph | ||
You can download a a trend graph that updates based on the value in the SoftPLC here. Changing the address parameter in the applet tag inside the INDEX.HTM file would alter the graphed variable. This table is based on Leigh Brookshaw's open source Java 2D Graph Package. Below is an example display of the graph:
Bar Chart | ||
Creating a bar chart through JavaScript and SmartPage is simple as well! The files required for this chart can be downloaded here.
In the chart.html file, there is a <script> section, which is where the configuration is made to change the appearance of the chart.